Data Analytics Services

Understand What Drives Performance and Where to Act Next

Our data analytics services help your teams understand performance and decide what to do next. eSparkBiz brings software and data engineering together to connect fragmented reports, define shared metrics, and build dashboards and analysis around the questions your business needs answered.

  • 15+ Years of Experience
  • 400+ Engineers
  • 4.9/5 Clutch Rating
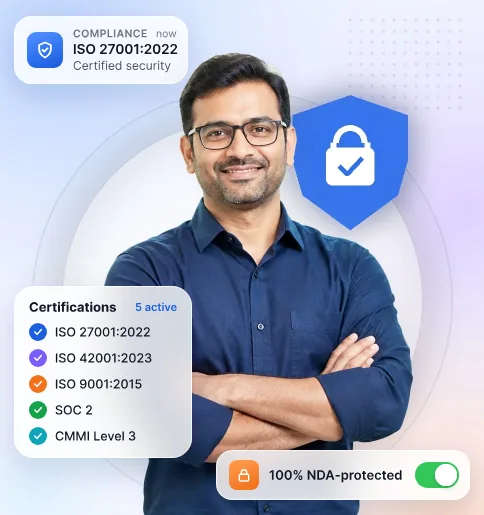
  • ISO 27001 & ISO 9001
  • 1,000+ Projects Delivered
Core Objective

Give business teams a consistent view of performance, with traceable calculations and timely information for the decisions they own.

Business ROI

Measure reporting hours saved and faster issue resolution against your baseline, accounting for implementation, licensing, cloud usage, and ongoing support costs.

Tech Stack We Evaluate
  • Power BI
  • Tableau
  • SQL
  • Python
Service Overview

What Our Data Analytics Services Cover

Data analytics services turn business data into reports, explanations, and forecasts that support decisions. The work can include preparing data, defining metrics, building dashboards, and testing analytical models. The scope depends on the questions you need answered and the reliability of your source data.

Use this service when reporting spans systems or a business question needs deeper analysis. A standard report may be enough for a simpler need. Limited data preparation can sit within the analytics scope; major pipeline repairs, warehouse builds, and standalone machine learning development need separate scope.

What this can include Connected Delivery Workstreams

  • 01. Define

    Business Questions and Metrics

    Define the decisions, calculation rules, and accountable owners that make performance measures useful across departments.

  • 02. Prepare

    Data Preparation and Validation

    Combine relevant records, resolve quality issues, and reconcile analytical datasets with agreed source totals before reporting.

  • 03. Develop

    Dashboards and Self Service BI

    Build reports around user tasks, with shared definitions and appropriate access controls for independent analysis.

  • 04. Analyze

    Advanced Analysis and Forecasting

    Investigate performance drivers and test forecasts against historical baselines, making assumptions and uncertainty visible to decision-makers.


Challenges we address

When Your Reports Leave Important Questions Unanswered

Start with the reporting problem that costs your team time or delays a decision. These six situations help identify where analytics work can make a practical difference.

  • Conflicting Versions of Performance

    Finance and operations report different revenue totals, delaying decisions. Align recognition rules, reporting periods, and source ownership so teams can reconcile differences before reviewing performance

  • Too Much Manual Reporting

    Analysts spend each reporting cycle joining exports and fixing spreadsheets. Automate repeatable preparation and validation so their time shifts toward investigating changes and advising stakeholders.

  • Dashboards Without Useful Answers

    Reports show that margins fell but offer no way to investigate. Add relevant breakdowns and drill paths so teams can examine likely contributors.

  • Stale or Incomplete Data

    A dashboard looks current while a source feed has stopped. Define freshness checks and visible exceptions so users know when figures need investigation.

  • Forecasts Without a Reliable Baseline

    Planning teams receive predictions without evidence that they improve on existing methods. Test against historical periods and simple baselines before using forecasts in operating decisions.

  • Self Service With Unclear Boundaries

    Business users either wait for analysts or create conflicting reports. Provide reusable metrics, role-based access, and practical guidance so independent analysis remains consistent.


Our Services

Data Analytics Services We Offer

Build new reporting, investigate a performance change, or improve analytics already in use. We shape the scope around your business priorities, available data, and existing tools.

  • Analytics Strategy and KPI Planning

    Focus analytics investment on decisions your teams can act on. We translate stakeholder questions into prioritized requirements, measurable objectives, and a practical delivery scope.

    • Decision and stakeholder mapping
    • KPI ownership and success measures
    • Prioritized analytics backlog
  • Data Preparation and Quality

    Prepare the records needed for your analysis. We connect agreed sources, standardize records, and investigate gaps that could distort reports or models. Substantial upstream repairs are scoped separately.

    • Source mapping and scoped pipelines
    • Completeness and duplication checks
    • Reconciliation and exception reports
  • Semantic Modeling and Metric Governance

    Make shared measures behave consistently across reports. We define business entities, calculation logic, and relationships in reusable models that teams can review and maintain.

    • Data grain and relationship design
    • Versioned measures and business glossary
    • Filter and aggregation tests
  • BI and Dashboard Development

    Help users move from a performance summary to the detail behind it. We build dashboards around recurring decisions, with clear comparisons and useful drill-down views

    • Role-specific reports and dashboard layouts
    • Time comparisons and drill-through paths
    • Refresh configuration and usability checks
  • Diagnostic Analysis and Experimentation

    Understand which factors warrant attention when performance changes. We examine segments and trends, then design comparisons or experiments to test explanations where feasible.

    • Cohort and variance analysis
    • Experiment design and success criteria
    • Findings with assumptions and limitations
  • Predictive Analytics and Forecasting

    Support planning with forecasts whose usefulness can be tested. We assess available history, compare suitable methods, and explain uncertainty before predictions enter business workflows.

    • Historical data and leakage checks
    • Backtesting against simple baseline methods
    • Forecast ranges and monitoring criteria
  • Self Service and AI Assisted Analytics

    Help business users answer routine questions with governed data. Where natural-language querying adds value, we evaluate its answers against approved metrics and access rules.

    • Reusable datasets and user guidance
    • Reference questions and answer validation
    • Permission checks and fallback behavior
  • Embedded Analytics Development

    Bring relevant reporting into the applications customers or employees already use. We integrate analytical views with application workflows while testing authorization and tenant boundaries.

    • Application integration and identity mapping
    • Tenant isolation and export controls
    • Usage and performance instrumentation
  • Analytics Optimization and Support

    Improve analytics that has become slow, expensive, or difficult to maintain. We review workload behavior and report usage, then prioritize changes against an agreed baseline.

    • Query and refresh performance tuning
    • Usage and operating-cost reviews
    • Runbooks and scoped support responsibilities
Deliverables and Outcomes

What Your Team Receives and How to Measure Value

Agree on deliverables and acceptance checks before implementation. The selected scope determines which artifacts are produced and which business measures will track their value.

Expected Deliverables

Analytics Your Team Can Inspect and Use

The agreed scope identifies which assets your team receives. These should make the numbers traceable, the implementation reviewable, and routine operation understandable to the people taking ownership.

  • Metric and Data Specifications

    A documented record of definitions, source mappings, calculation rules, and owners, checked against representative business questions before implementation.

  • Tested Datasets and Reports

    Selected datasets, semantic models, and dashboards with reconciliation results, filter tests, and access checks tied to agreed acceptance criteria.

  • Analysis and Validation Records

    For diagnostic or predictive work, findings include assumptions, test periods, baseline comparisons, and limitations so stakeholders can judge appropriate use.

  • Operational Handover Package

    Refresh schedules, dependency notes, failure procedures, and maintenance responsibilities support handover, with walkthroughs covering routine operation and common exceptions.

Intended Outcomes

Improvements Measured Against Your Starting Point

Set a baseline before changes go live and review results over an agreed period. Benefits depend on data reliability, adoption, and the decisions people make.

  • Less Reporting Preparation

    Compare time spent collecting, correcting, and assembling recurring reports before and after delivery, while tracking the effort required for ongoing maintenance.

  • More Consistent Performance Measures

    Track reconciliation exceptions and disputed KPI definitions across departments to assess whether shared models reduce disagreement about the underlying numbers.

  • Faster Investigation of Changes

    Measure how long users take to investigate a variance or answer a recurring question using the agreed reports and analytical views.

  • Better Supported Planning Decisions

    Where forecasting is included, compare forecast error with existing methods and review how planners use predictions alongside business judgment.


Case Studies

Data Analytics in Practice

Review the business problem, delivered analytics, and evidence behind each result to assess relevance to your own environment.Review the business problem, delivered analytics, and evidence behind each result to assess relevance to your own environment.

Case study
  • Industry : eCommerce
  • Solution : AI Development

SmackDab is an AI-enabled Customer Relationship Management (CRM) platform engineered by eSparkbiz to help businesses build stronger customer relationships, optimize sales workflows, and drive sustainable.

  • Dedicated Product Team Engagement Model
  • 40 + Team Member
  • 48+ Months Partnership Duration
  • Live & Scaling Market Stage
Client outcomes

Rated 4.9 across 70 Reviews Verified on Clutch

Our clients value our technical expertise, clear communication, and commitment to quality. Read their feedback on working with eSparkBiz and see how our engineering teams support their business goals.
Paul Fletcher

Paul Fletcher

Founder, UGC Social Platform

eSparkBiz handles frontend and backend development for a user-generated content social platform, offering advice, recommendations and creative solutions using the latest technology. The founder had been let down by earlier vendors, so the hands-on management, quick delivery and smooth communication over Slack and Asana really stood out. The founder described the team as friendly, reliable and highly proficient.

Hussein Badr

Hussein Badr

Product Manager at Robusta Studio

Within two months, eSparkBiz delivered the primary version of a cross-platform mobile app for an Egyptian software agency, built to validate its business value proposition. The app had not launched at the time of the review. The client found the quality, speed and responsiveness very impressive and only suggested clearer progress reports.

Use Cases

Put Analytics to Work in Everyday Business Decisions.

These examples show how analytics can support specific decisions. Each application needs suitable data, an accountable business owner, and a clear way to evaluate usefulness.

  • Leadership · Finance

    Executive Performance Reviews

    Leadership reviews need a shared view of revenue, costs, and operating performance. Connect headline measures to the supporting detail, using consistent reporting periods and visible exceptions so leaders can investigate changes before setting priorities.

  • Customer Success

    Customer Retention Analysis

    Customer success teams can compare account cohorts, product usage, and support history to investigate weakening engagement before renewal. The analysis helps prioritize attention; warning signals still need validation before teams decide which intervention is appropriate.

  • Sales

    Sales Pipeline Forecasting

    Sales leaders can assess conversion patterns, deal aging, and expected revenue when planning the next period. Test forecasts against historical outcomes and account for incomplete CRM records or changes in how teams qualify opportunities.

  • Product

    Product Adoption Analysis

    Product managers need to see where users reach value, abandon a workflow, or stop returning. Event sequences and cohorts reveal where to investigate, provided tracking definitions stay consistent and instrumentation changes are accounted for.

  • Finance · Commercial

    Margin and Pricing Analysis

    Examine profitability by product, customer, or channel before changing prices or reducing an offering. Bring sales, discount history, and relevant costs together, with allocation assumptions visible to the commercial and finance teams reviewing the results.

  • Supply Chain

    Demand and Inventory Planning

    Compare demand forecasts with stock availability and replenishment constraints when setting purchasing priorities. Validate performance across relevant periods and account for stockouts: recorded sales can understate demand when customers cannot buy the product.

  • Service Operations

    Service Operations Monitoring

    Backlog age, resolution times, and repeat requests can reveal where service work stalls. Segment results by case type and workload so managers can distinguish capacity problems from process issues before changing staffing or service priorities.

  • Product · Engineering

    Embedded Customer Reporting

    Give customers reporting within the product they already use. Relevant filters and exports help them review activity in context, while authorization checks and tenant isolation keep each account within its permitted data boundaries.


Industries

Industries We Serve with Data Analytics Services

eSparkBiz provides data analytics services for diverse industries, including healthcare, fintech, SaaS, and more. We help companies turn raw data into clear dashboards, spot trends earlier, track performance, and make decisions backed by reliable numbers.

SaaS Data Analytics Services Covering Churn, Expansion and Feature Adoption

Downgrades, credits and parent accounts blur billing records until finance and product each report a different churn rate. eSparkBiz joins billing, CRM and product events under one set of definitions, so retention and adoption figures survive board scrutiny.

What We Analyze:
  • Net Revenue Retention Models
  • Plan Change Tracking
  • Feature Adoption Funnels
  • Account Hierarchy Rollups
  • Renewal Risk Signals
  • AI Queries on Approved Metrics
Compliance & Security
  • PII masked in dashboards
  • Per-account row filters
  • Downloads limited by role
  • Billing data access logged
  • Success Metrics:

    Churn dashboards helped teams spot at-risk accounts, cut cancellations, and protect renewals.

    Cost & Timeline

    Starting Budget: From $10,000, shaped by billing systems and plans

    Initial Delivery Phase: 5 to 7 weeks, ending with agreed retention definitions

    Drivers: Billing platforms, plan complexity, product event volume, account hierarchies and embedded reporting needs determine pricing.

    FAQs:
    Is a product analytics tool enough for a SaaS company, or is outside analytics help needed?
    eSparkBiz usually recommends the tool alone when event tracking is clean and one team owns it. A partner pays off once billing, CRM and product data disagree, because no tool settles conflicting definitions of an active account or a churned customer by itself.
    Can eSparkBiz show which product features drive expansion revenue?
    Yes. eSparkBiz compares upgrade timing with feature usage across account cohorts of similar size and plan. The findings show which features tend to come before expansion, and we state plainly where the link is only correlation, so product bets get tested before roadmaps change.
    Why should SaaS revenue reporting track usage of AI features?
    They add a cost line that subscription metrics often miss: model usage per account. We attach those costs to accounts and plans, so margin by customer reflects what heavy AI users really cost to serve, and pricing changes rest on actual usage.

    Our Process

    How We Deliver Your Analytics Project

    Each stage answers a delivery question, from choosing the first useful release to assigning ongoing ownership. Your engagement model defines who manages day-to-day work and who approves decisions.

    Step 01 · Define

    Agree on the Decisions to Support

    We start with the decisions your team needs to make and the reports it uses today. Your business sponsor approves the initial priorities and success measures.

    Bring Us Your Reporting Questions
    WHAT’S INCLUDED
    • Identify users and decision frequency
    • Review current reports and pain points
    • Name metric owners and acceptance reviewers
    • Approve the analytics brief and exclusions
    Outcome : Approved brief with agreed priorities
    Technology Ecosystem

    Choose Analytics Tools That Fit Your Existing Systems

    Evaluate tools against user needs, existing investments, and operating requirements. The options below are candidates for assessment, not a requirement to replace your current stack.

    Reporting Tools Your Users Can Work With

    Assess dashboard usability, sharing, embedding, and licensing against actual user roles. Retain your existing BI tool when it meets requirements without disproportionate workarounds.

    • Power BI
    • Tableau
    • Looker

    Proposal Evaluation

    Compare Data Analytics Proposals With Confidence

    Compare what each proposal delivers, how you will accept the work, and what it will cost to operate. A smaller engagement can be the right choice when it resolves your reporting need.

    What to Check in Any Proposal eSparkBiz Proposed Approach
    Scope and Source Responsibility
    Does the scope identify reports, metrics, source changes, and exclusions? A dashboard-only engagement can fit when validated datasets already exist; incomplete inputs require additional preparation.
    Document the reporting boundary and assign each data dependency to an owner. Include only agreed preparation work, with major platform changes estimated separately rather than assumed within dashboard delivery.
    Technology and Data Freshness
    Can the existing stack meet the need? Scheduled refresh suits periodic reviews; more frequent updates are worthwhile only when users can act on newer information.
    Test the current tools against representative workloads before proposing replacement. Agree freshness targets with business owners and explain the integration, monitoring, and running-cost implications of meeting them.
    Acceptance and Analytical Limits
    How will you verify calculations, permissions, and user tasks? Visual approval alone does not validate totals. Forecast evaluation also needs a baseline and suitable historical test periods.
    Agree acceptance examples before development and provide reconciliation, access, and usability evidence for the scoped work. For forecasts, report error and limitations; retain a simpler method if added complexity provides no useful improvement.
    Operating Cost and Ownership
    Does the price separate initial delivery from licenses, infrastructure, and support? Internal operation requires available maintainers; ongoing provider support needs defined coverage and change responsibilities.
    Specify handover materials and client operating tasks alongside delivery fees. Where support is requested, propose its boundaries and recurring cost basis separately, with a clear route for approving changes.

    Agreed Before Kickoff

    • Bounded scope
    • Freshness targets
    • Test evidence
    • Handover terms
    Why eSparkBiz

    Software and Data Engineering Behind Your Analytics

    Analytics depends on the applications, definitions, and people behind each report. eSparkBiz is an AI-native software and product engineering company. These priorities shape the analytics engagement we propose for your team.

    • 15+ Years in Business
    • 20+ Industries Served
    • 4.9 Clutch 70 Reviews
    • 1,000+ Projects Delivered
    • 400+ Engineers
  • 1,000+ projects across 20+ industries, supported by expertise across 45+ technologies.
  • Collaboration across 10+ time zones combines agreed working hours with named contacts, progress reviews, and escalation paths.
  • Clear IP ownership and confidentiality terms address custom work, third-party licenses, and NDA obligations.
  • Discovery-led planning aligns your goals, scope, and technical dependencies before delivery begins.
  • 95% client retention, earned by staying accountable after go-live.
  • Streaming analytics surfaces fraud signals and alerts as events arrive.
  • Procurable on AWS Marketplace as Data Analytics Consulting and Modernization.
  • Teams Ramp Up Within 48-72 Hours, accelerating analytics assessment kickoff.
  • Assessments expose redundant reports, governance gaps, and wasteful analytics spending.
  • Showcased in The Manifest’s Top NLP Companies Directory.
  • Cross-functional engineering teams assess the right approach, including where AI adds value.
  • Flexible engagements with planned continuity define responsibilities, replacement arrangements, and knowledge transfer.
  • Featured among RevenueBase’s India AI Workflow Automation Services Directory listings.
  • Transparent scope and costs require approval of budget and schedule changes before additional work begins.
  • Phased delivery with quality and security reviews provides checkpoints and clear release accountability.
  • Defined access, handover, and support options help your team maintain continuity during and after the engagement.
  • Quality and security reviews support delivery, with named owners responsible for release decisions.
  • Ongoing technical support options help you maintain your systems and respond to changing business needs.
  • Tell us what your reporting cannot explain today. We can discuss the business question, engineering dependencies, and a starting scope your team can evaluate.

    Plan Your Analytics Project
    Governance & security
    • ISO 27001:2022
    • ISO 9001:2015
    • SOC 2
    • CMMI Level 3
    • 100% NDA-protected
    Platform Capability
    • AWS Certified Solutions Practice
    • Multi-cloud: AWS, Azure, GCP
    • AI, Cloud & Blockchain
    Company & Credentials

    CIN U72900GJ2013PTC073284 · Certification & audit documentation available on request under NDA.

    Engagement Models

    Choose How Your Analytics Work Is Delivered

    Choose the model around your management capacity and how clearly the work is defined. Each proposal should identify delivery responsibility, acceptance authority, and the treatment of changes.

    01 / 03

    Staff Augmentation

    Add analytics specialists to a team you manage. This fits organizations with an established backlog and technical leadership that need additional capacity for reporting, modeling, or analysis.
    Add Analytics Skills to Your Team
    • Your lead sets priorities and assignments
    • Your team manages delivery and dependencies
    • Specialists follow your agreed engineering standards
    • Your reviewers accept the completed work
    • You control backlog and scope changes
    • Capacity, access, and handover terms are agreed

    FAQs

    Frequently Asked Questions

    Get clarity on pricing, trials, data protection, tools, delivery commitments and ongoing support costs before you request a proposal, so you know exactly what to expect from eSparkBiz.

    Which analytics platforms and visualization tools do top analytics agencies use?

    For enterprise use, Tableau, Power BI and Looker lead most shortlists, and eSparkBiz evaluates all three alongside SQL, dbt and Python for preparation underneath. Capable agencies choose a tool only after reviewing your licenses, user roles and embedding needs, and they keep your current tool whenever it already answers the business questions well.

    How can a small business benefit from outsourcing data analysis?

    Outsourcing gives a small business senior analysis without a full-time salary, and with eSparkBiz that work costs under $25 an hour. The bigger gain is time: owners stop rebuilding spreadsheets every month and get one trusted view of sales, costs and customers. Keep ownership of metric definitions in-house so the decisions stay yours.

    Which pricing models suit enterprise data analytics solutions?

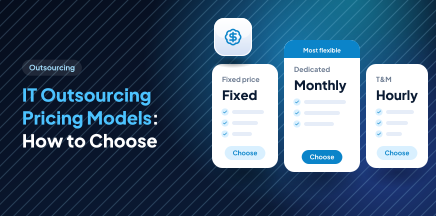
    Most vendors price enterprise analytics three ways: one fee for a bounded scope, an ongoing team for changing backlogs, or individual specialists at hourly rates. eSparkBiz supports all three, each starting at $10,000. Whatever you pick, have every proposal show implementation fees on lines separate from licenses, cloud consumption and ongoing support.

    Can startups afford data analytics services from eSparkBiz?

    Yes. eSparkBiz starts engagements at $10,000 and keeps rates under $25 an hour, which lets a startup fund one focused first release rather than an entire analytics department. Most startups begin with investor and product metrics in one dashboard, built on tools they already use, then add forecasting once enough history exists to test it.

    Which data analytics services have strong data privacy policies?

    Certified to ISO 27001, eSparkBiz completes an NDA before your records arrive, which gives buyers a documented baseline. Beyond policy wording, check how a provider limits access by role, masks personal fields in reports, controls exports and deletes your data once the contract ends. Ask for those controls in writing.

    What should I ask a data analytics partner before hiring them?

    Ask how they would trace one disputed figure from a dashboard back to source records, which is the test eSparkBiz expects buyers to run. Then ask who approves metric definitions, what the estimate excludes, how forecasts get compared with simple baselines, and which documents your team keeps after handover to run reports alone.

    How do I find data analytics consulting services near me?

    eSparkBiz serves US and international clients with remote data analytics consulting, so distance rarely narrows the choice. Workshops, report reviews and acceptance testing run well over video calls and shared screens. A local consultant makes sense mainly when regular on-site sessions with frontline staff are essential to the work being done.

    Is there a way to trial eSparkBiz before a full data analytics engagement?

    Yes. Nothing is charged for your opening call with eSparkBiz, and if you want evidence before signing, a 15-day risk-free trial is offered. Many analytics vendors only offer software trials, which test a tool rather than the analysts building your reports. Use a service trial to check one real dashboard against source totals.

    How do you implement a new business intelligence platform with outside help?

    Start with the decisions the platform must support, then have an outside team like eSparkBiz profile your data, agree metric logic and build first reports while your users review them. Validate totals, permissions and refresh behavior before release. Finally, name owners for monitoring and changes, so the platform does not decay after go-live.

    What does ongoing analytics support from eSparkBiz cost a mid-sized company?

    Ongoing support from eSparkBiz is scoped separately from the first build and billed at under $25 an hour, so a mid-sized company pays only for coverage it actually uses. Cost depends on report count, refresh frequency, new-request volume and response expectations. Budget licenses and cloud compute on top, since those sit outside service fees.

    What are the best data analytics services for small businesses?

    eSparkBiz suits small businesses that need a working dashboard and clean numbers rather than a large platform, with engagements beginning at $10,000 and senior analysts billed under $25 an hour. Good small-business services begin with two or three recurring decisions, reuse tools you already pay for, and hand over reports your team can maintain.

    Which providers offer managed, cloud-based data analytics with real-time reporting?

    eSparkBiz builds cloud analytics and can keep it running as a managed service, backed by its AWS Advanced Tier Partner standing. Real-time reporting is worth paying for only when someone acts within minutes, as fraud or dispatch teams do. Most management reports work well on hourly or daily refreshes, which cost far less to operate.

    Can eSparkBiz integrate data analytics with our existing CRM software?

    Yes. eSparkBiz connects CRM records with billing, product and support data so pipeline, retention and revenue reports share matching customer IDs. The work usually involves removing duplicate accounts, aligning opportunity stages and handling incomplete CRM entries before forecasts depend on them. Your CRM stays the master copy, and analytics only reads from it.

    Which analytics providers offer AI and machine learning capabilities?

    eSparkBiz builds AI into analytics work wherever it outperforms simpler methods, adding machine learning forecasts and natural-language questions over approved metrics. Look for providers that backtest predictions against historical periods, check AI answers against approved metrics and access rules, and scope standalone model development separately from dashboard work, so fees stay comparable.


    Resources

    Insights from our engineering leaders.

    Our team shares practical insights on the technologies and engineering decisions shaping enterprise software today, grounded in real client work.